PublishedJournal of Chemical Theory and Computation · 22(5), 2574–2585 · 2026

One ML potential, 25 dopants: where it works and where it fails

Meta's universal UMA model reproduced DFT dopant formation energies with a mean absolute error of 0.374 eV across 25 dopants. Heating simulations then showed copper clustering, sodium moving through the layers, and N₂ forming inside the lattice.

Tutorial Code on GitHub Journal article Free full text

The problem

Dopants change MoS₂ properties, but simulation potentials are unavailable for many compositions. A general model needs validation before its predictions guide materials screening.

What I did

The study compared UMA formation energies and structural changes with density functional theory calculations. UMA small then simulated heating and cooling of doped MoS₂.

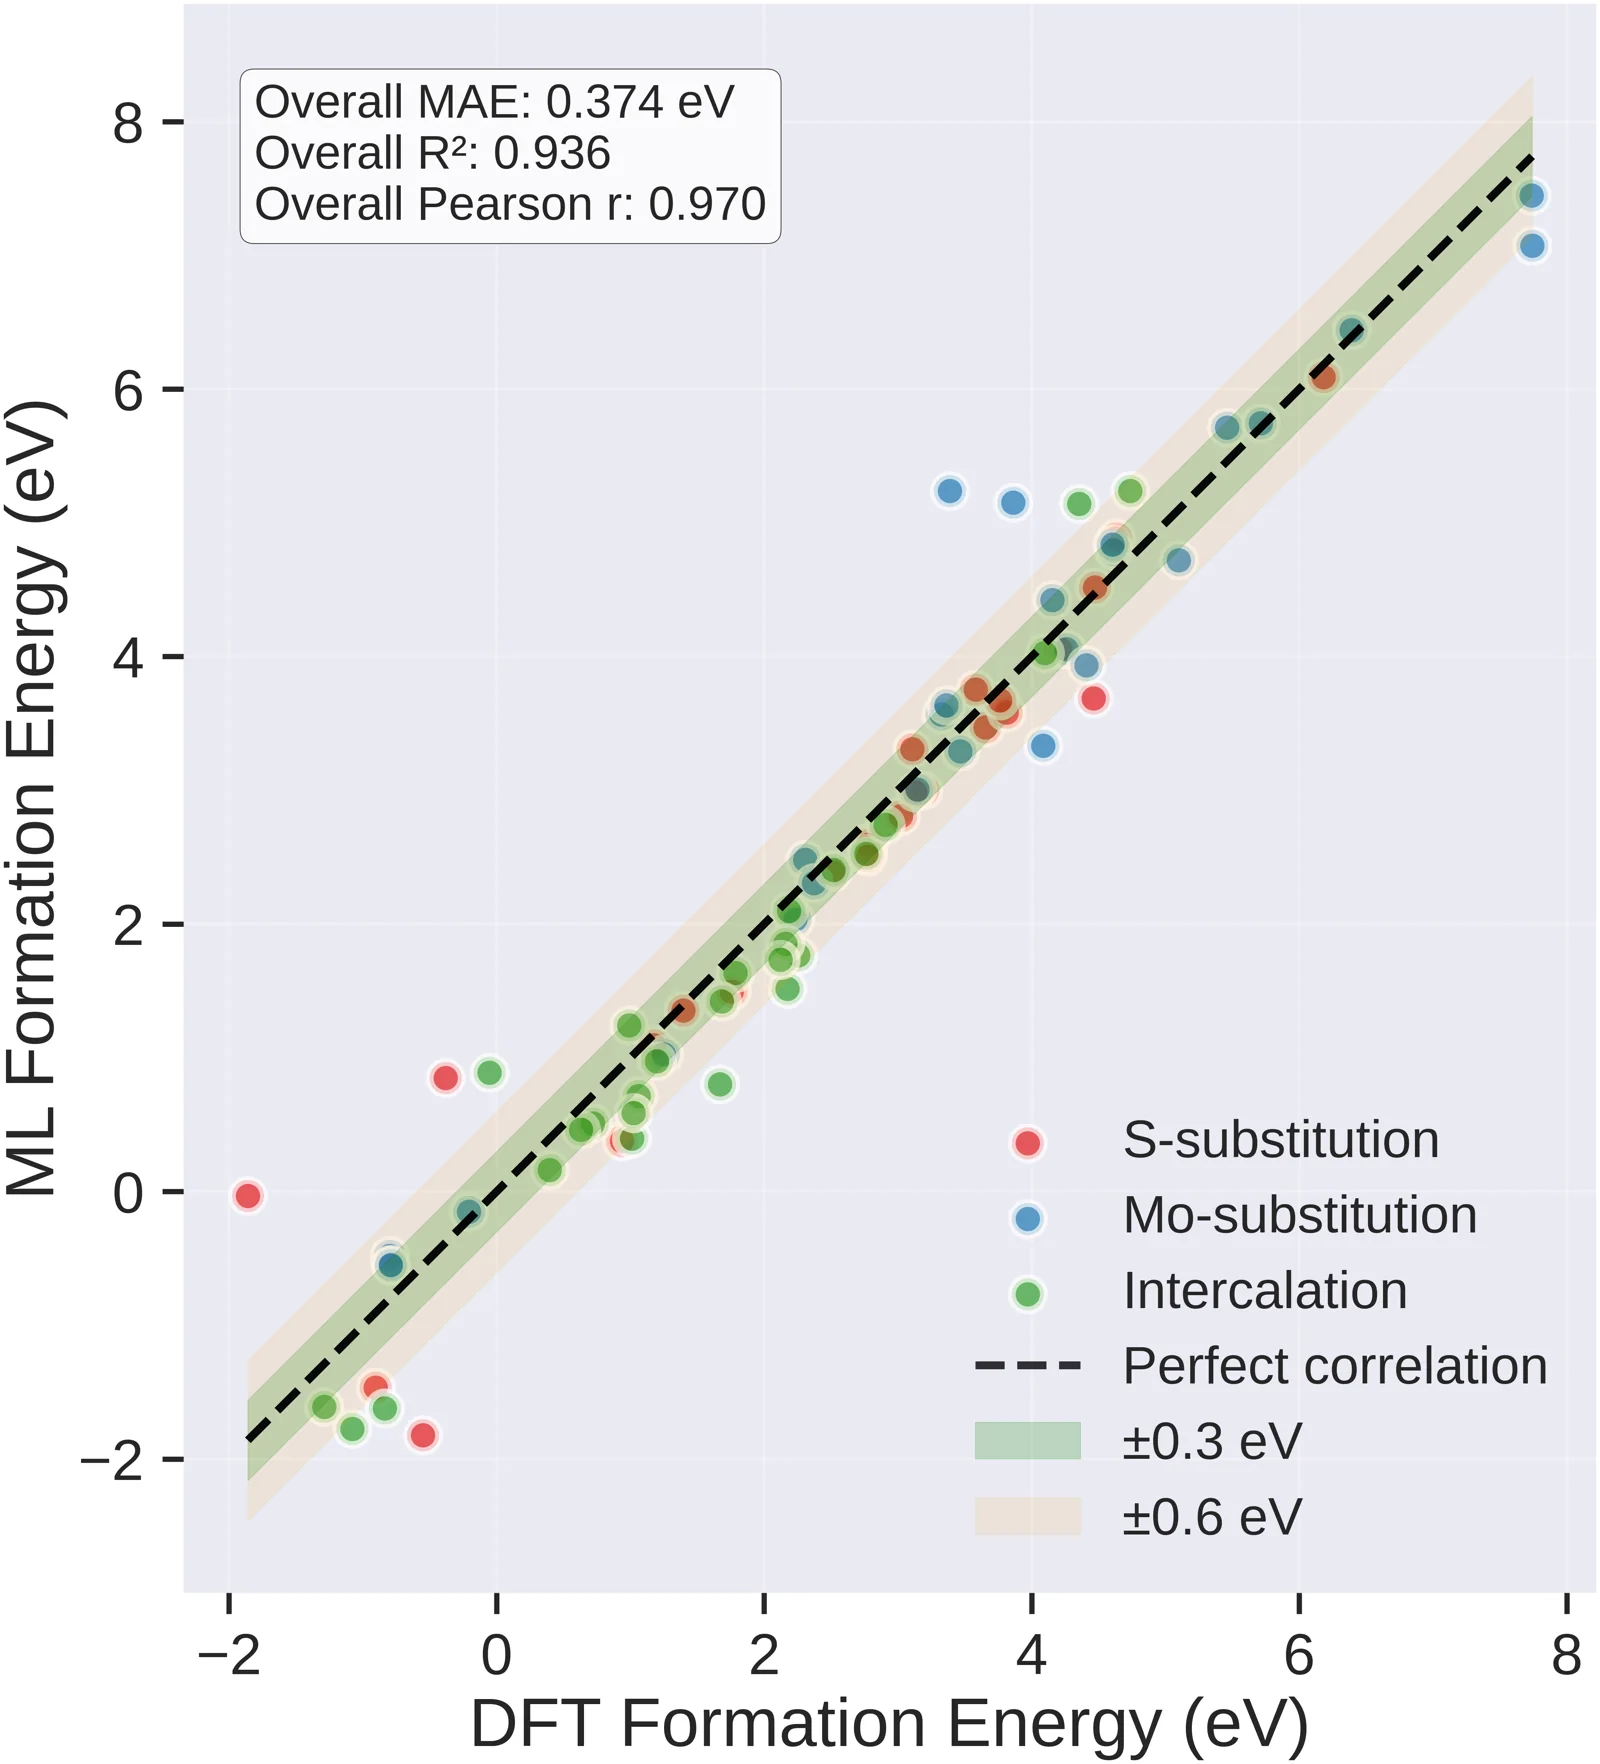
0.374 eV and 0.404 eVOverall formation-energy mean absolute error

UMA small had a lower average absolute error than UMA medium against DFT on the paper's dataset.

0.377, 0.360, and 0.326 eVUMA small formation-energy mean absolute errors by site

The errors describe sulfur substitution, molybdenum substitution, and intercalation, respectively; model accuracy varied with dopant position.

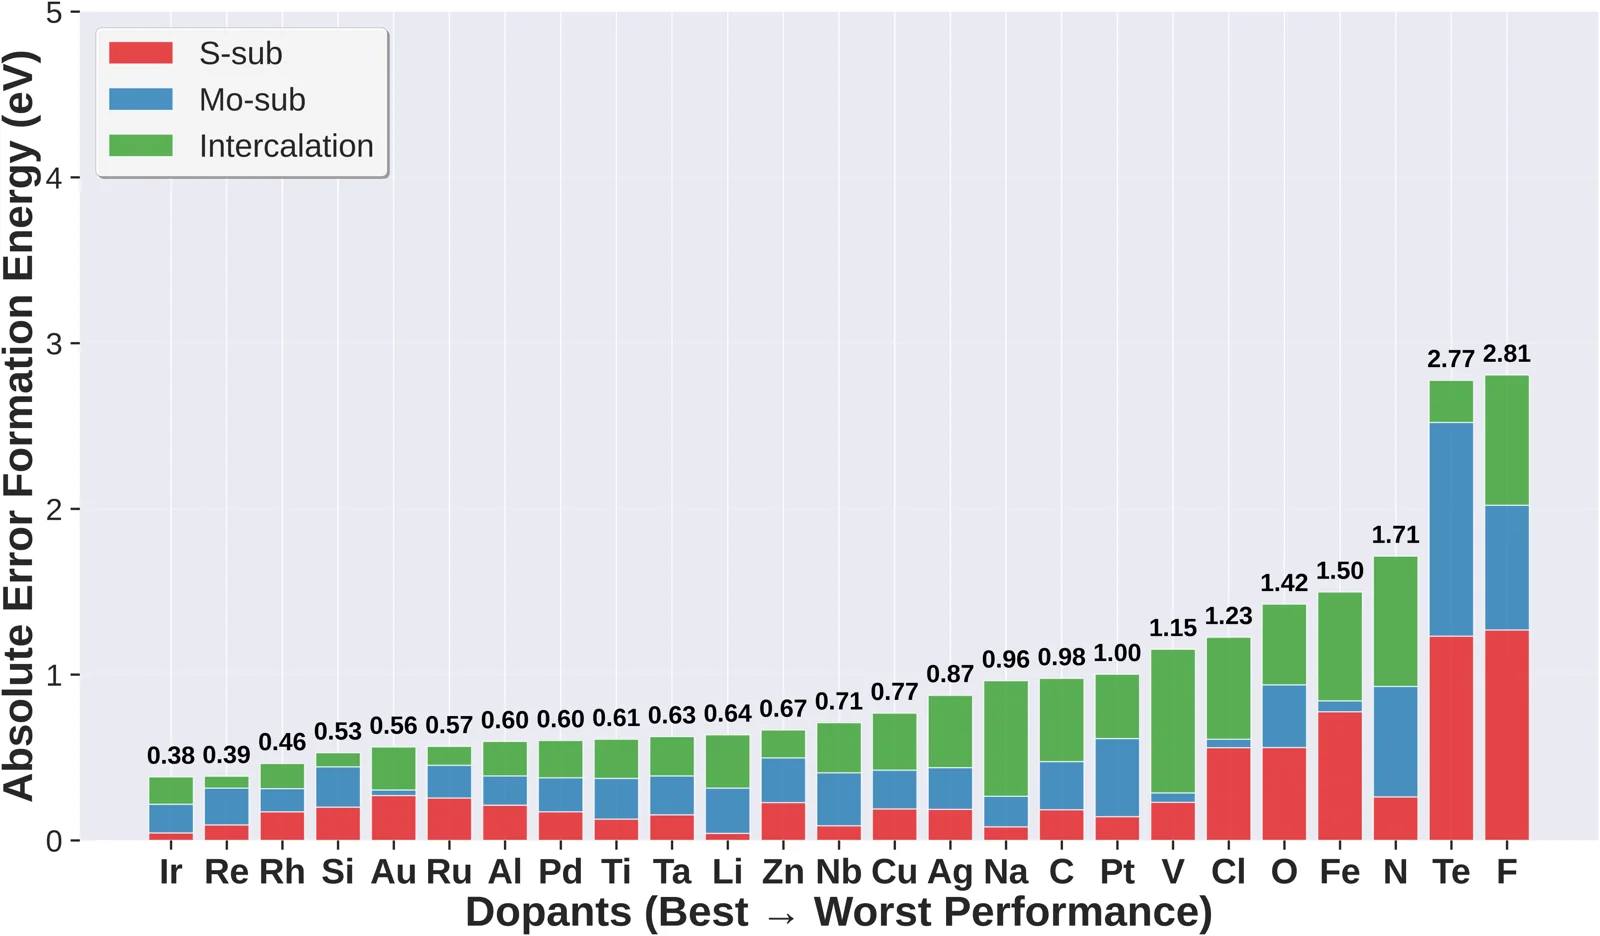
0.38–2.81 eVSummed absolute error across three sites

Summed absolute error across the three sites ranges from 0.38 eV (Ir) to 2.81 eV (F).

What we found

  1. UMA small formation-energy mean absolute errors were 0.377 eV for sulfur substitution, 0.360 eV for molybdenum substitution, and 0.326 eV for intercalation.
  2. Overall formation-energy mean absolute error was 0.374 eV for UMA small and 0.404 eV for UMA medium.
  3. Summed absolute error across the three sites ranges from 0.38 eV (Ir) to 2.81 eV (F).
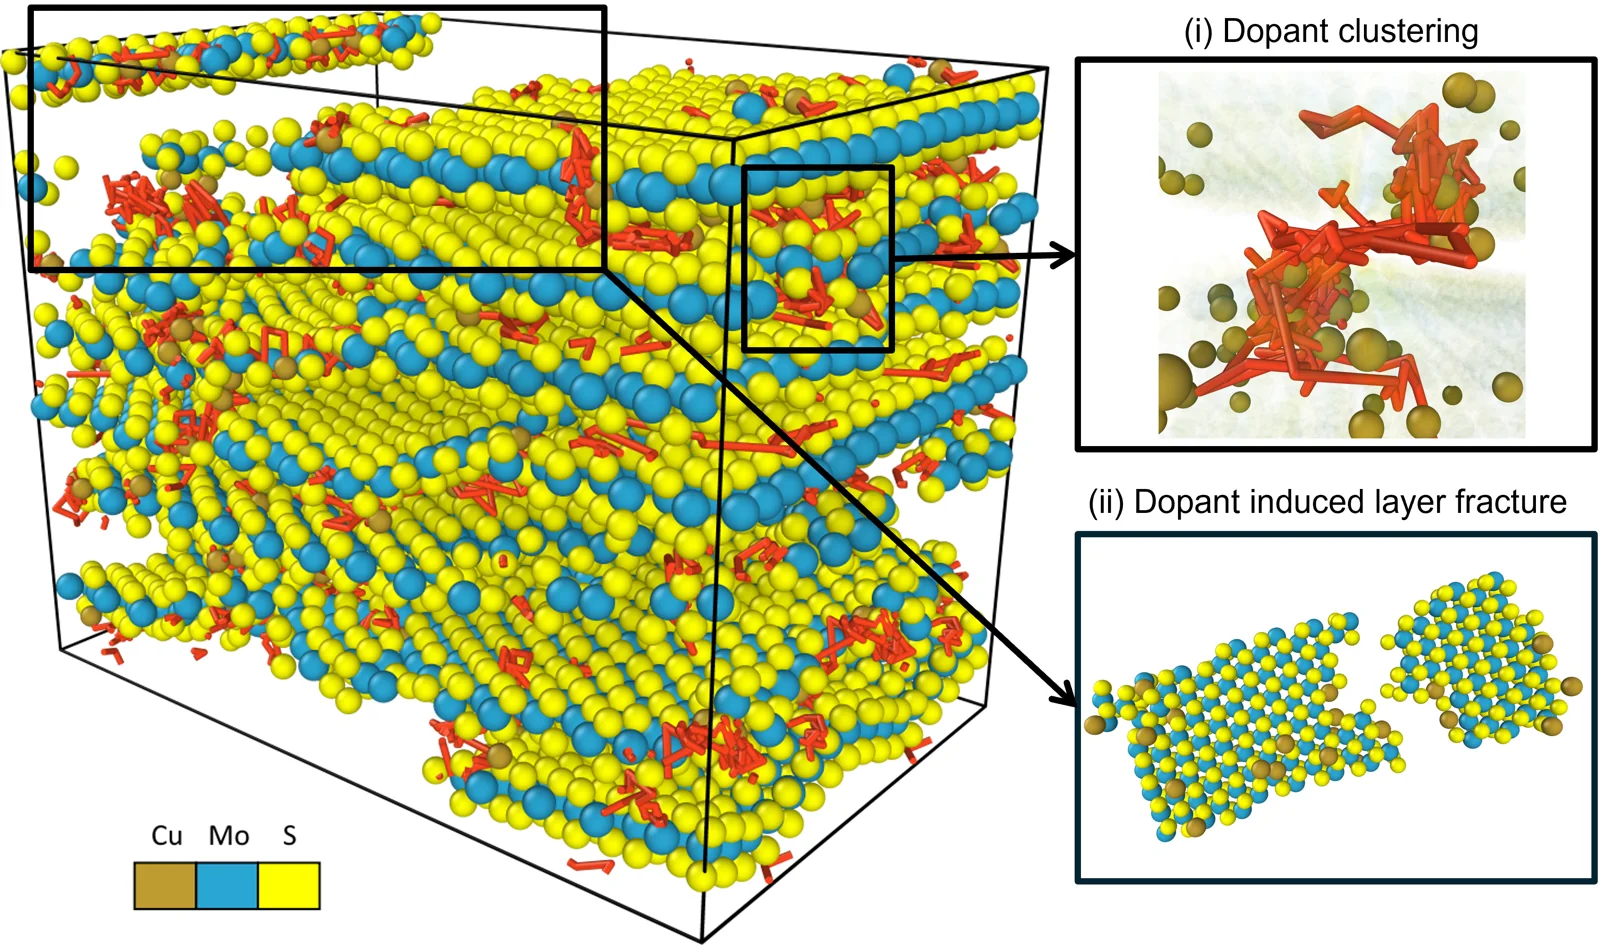
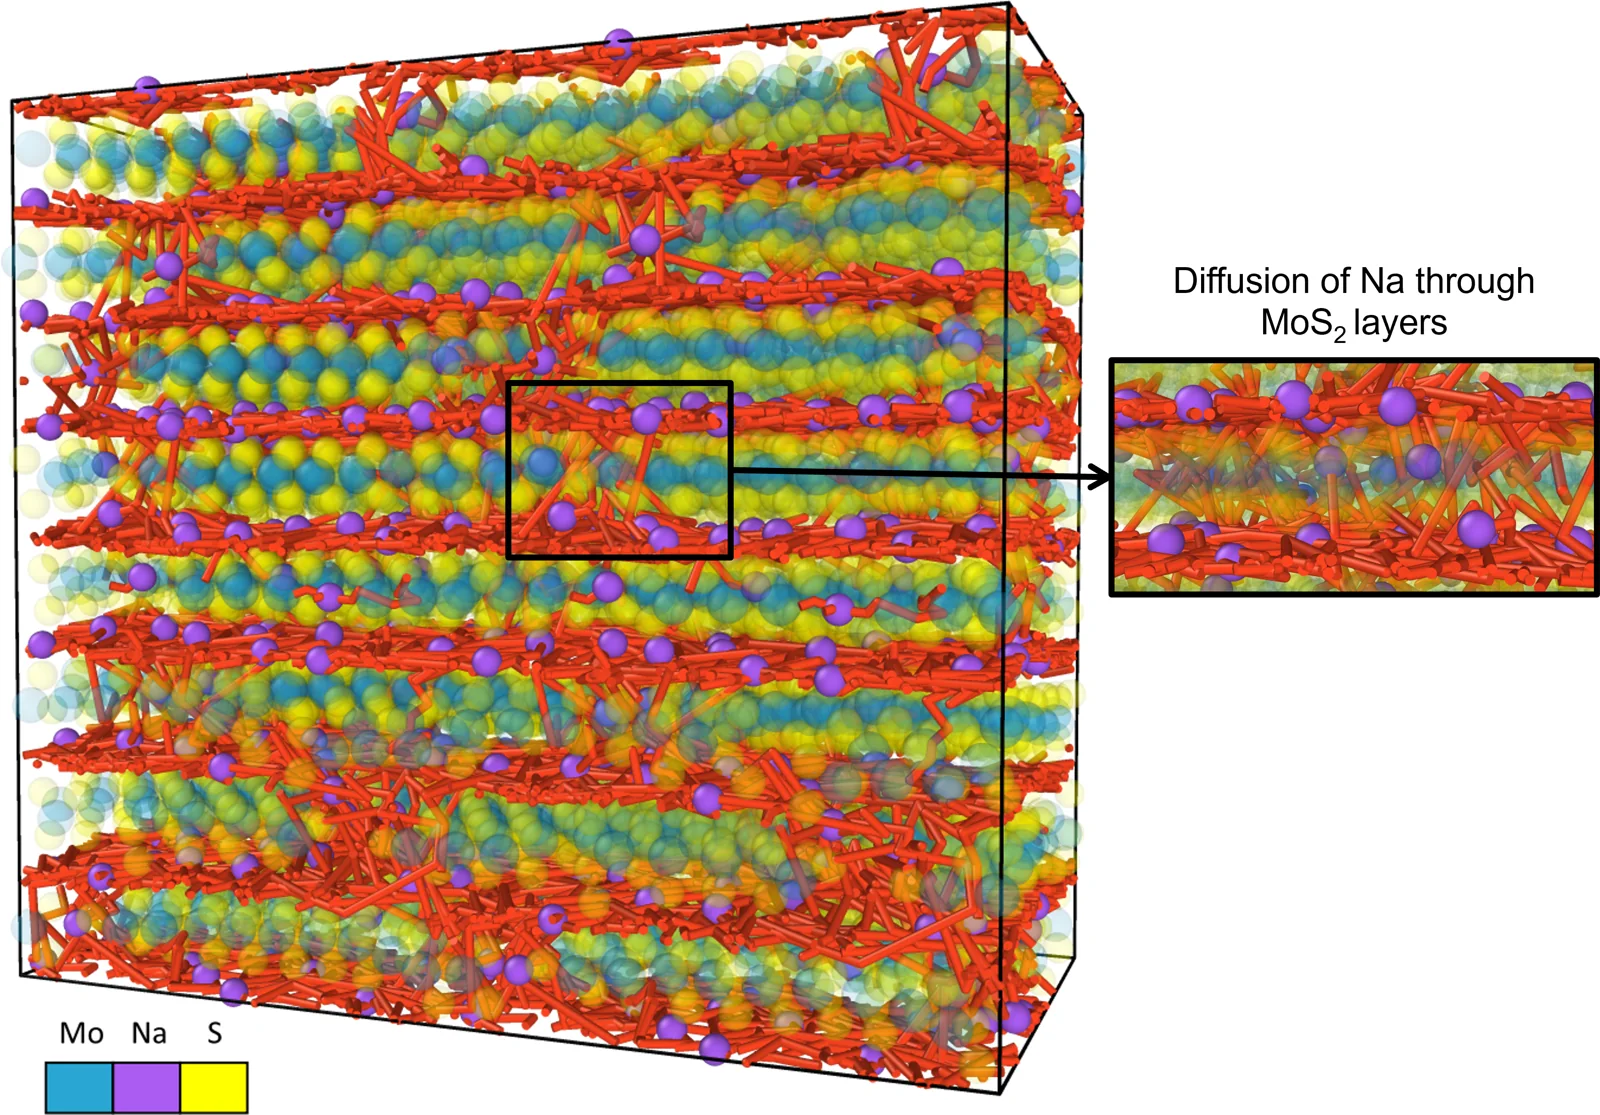
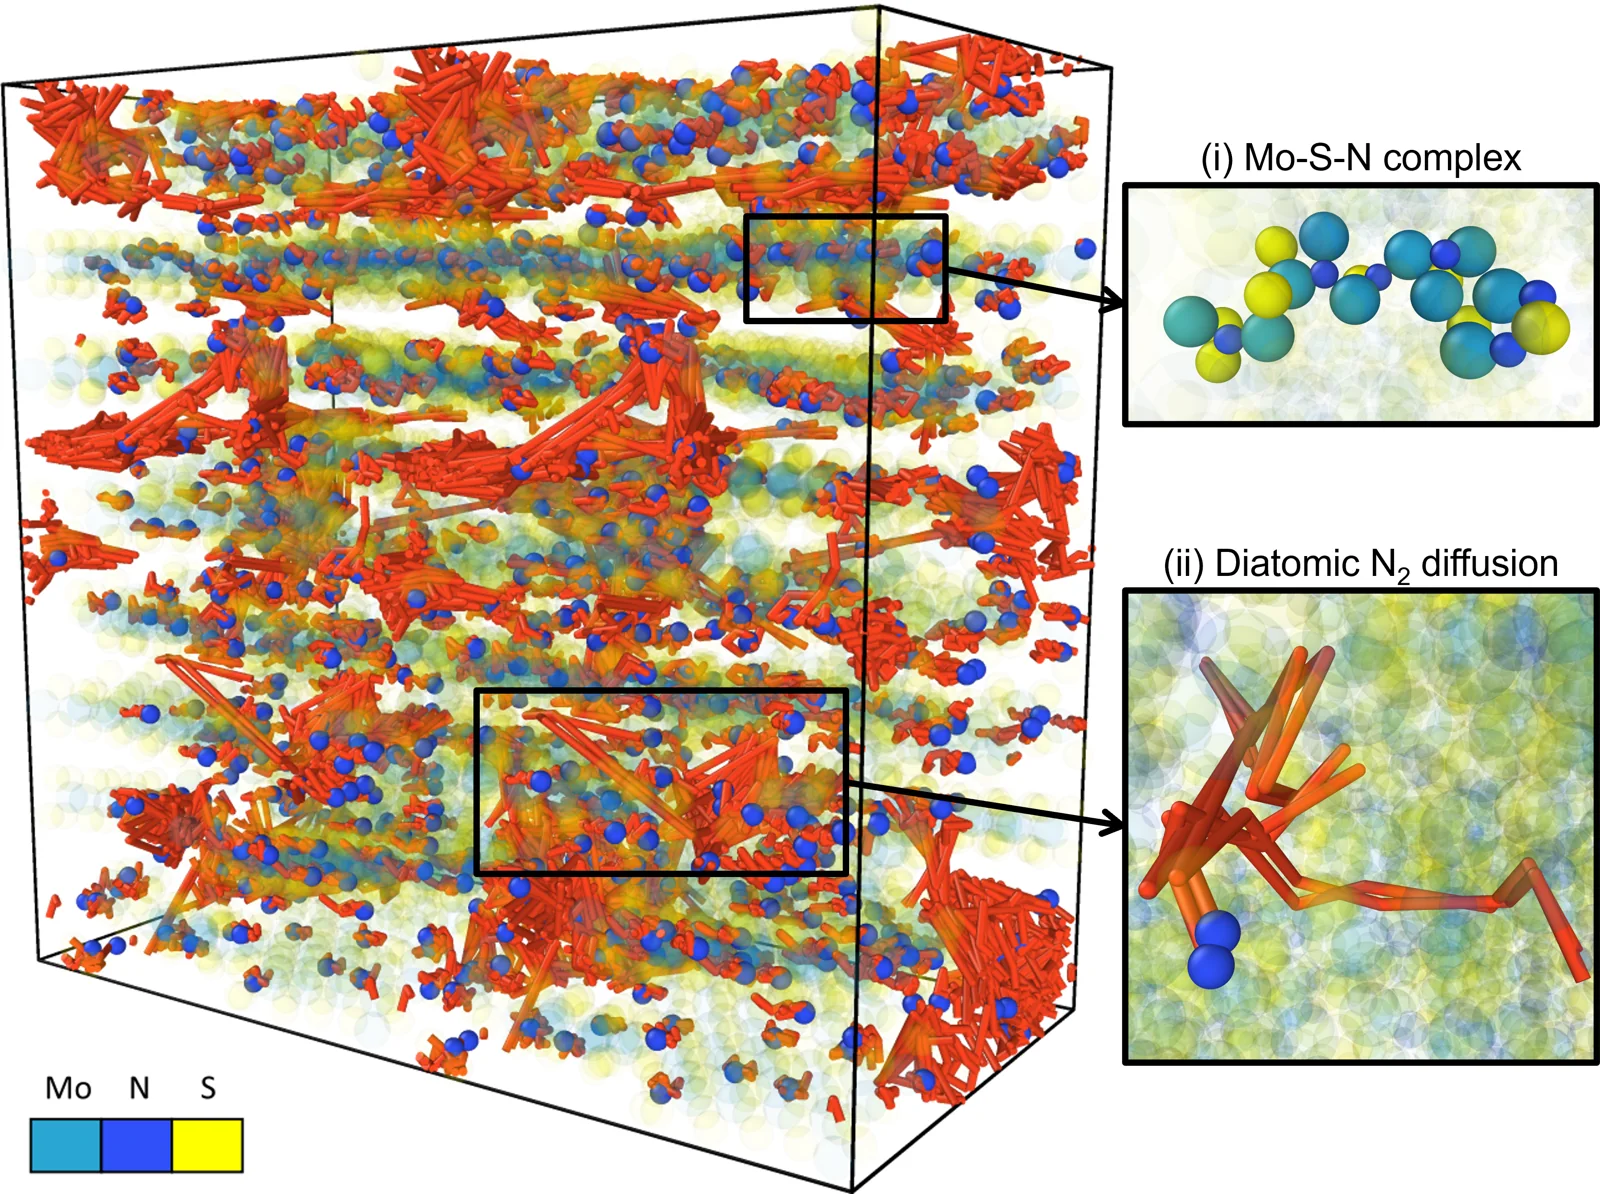
  4. Heating and cooling simulations showed copper clustering, sodium diffusion between and through layers, and formation of nitrogen molecules.

Figures
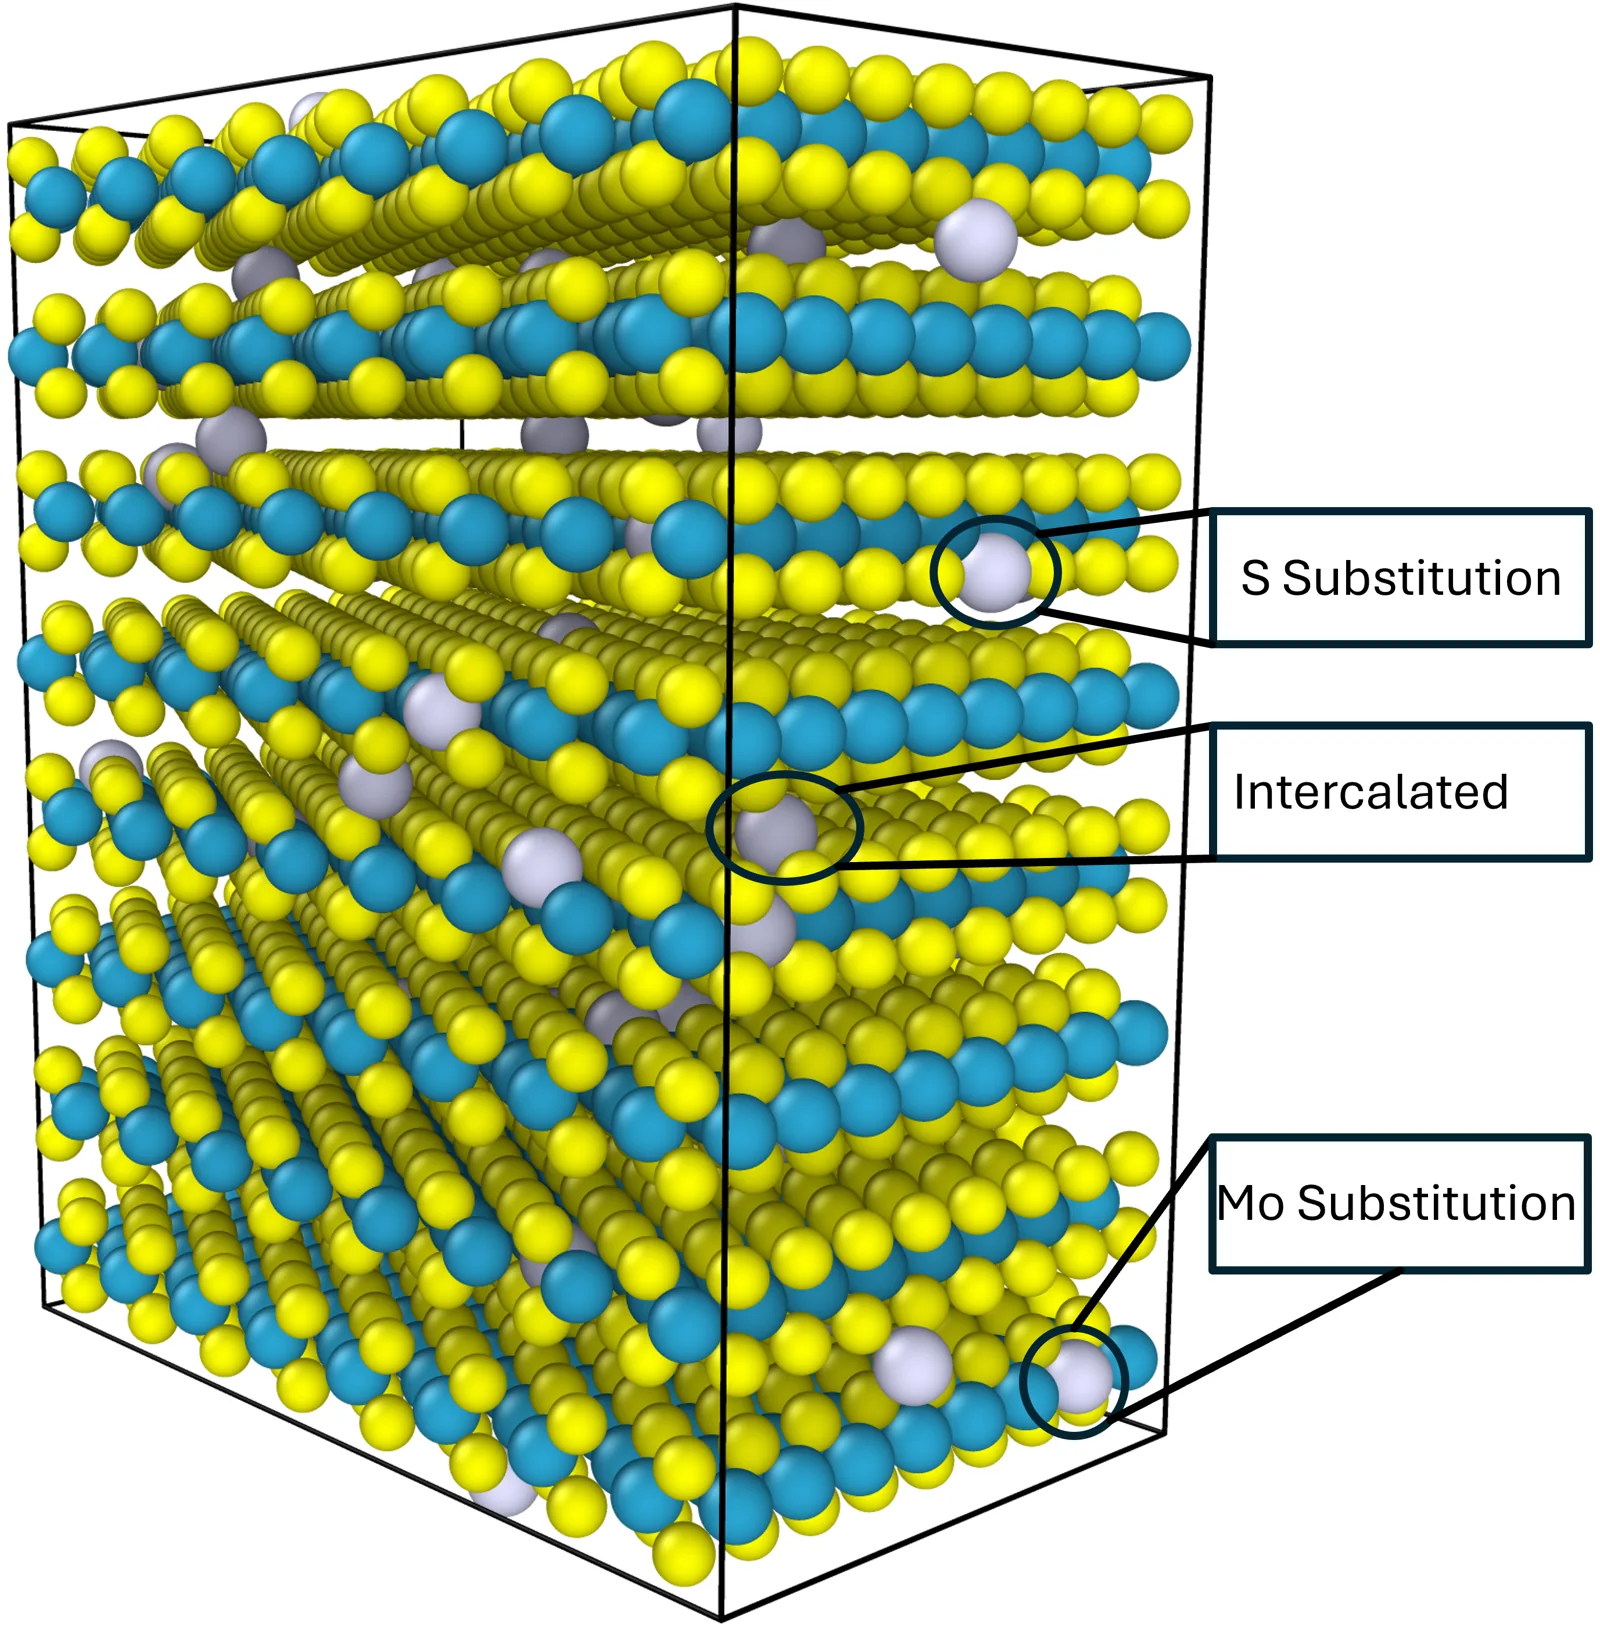
Atomistic diagrams of dopants replacing molybdenum or sulfur and sitting between layers.
Simulation setup. Dopants sit in three places: replacing Mo, replacing S, or between layers (intercalated). Each of the 25 dopants was tested in all three.
Two scatter plots of model-predicted versus DFT formation energies with diagonal reference lines.
UMA vs DFT formation energies. Points near the diagonal mean the ML potential reproduces DFT. Overall MAE: 0.374 eV (UMA small), 0.404 eV (UMA medium).
Stacked bars ranked by total formation-energy error, with a segment for each site.
Error by dopant, best to worst. Summed absolute error across the three sites ranges from 0.38 eV (Ir) to 2.81 eV (F).
Atomistic snapshots and red paths tracking copper atoms through the layers.
Cu clusters, then fracture. Red lines trace intercalated Cu atoms moving together to form a cluster. Once clustered, the dopants stop moving. Some dopants in this group also cracked the MoS₂ layers; undoped MoS₂ did not fracture.
Atomistic views of sodium paths between and across molybdenum disulfide layers.
Na moves through the layers. Sodium diffuses between and across MoS₂ sheets, consistent with the low Na diffusion barrier reported by DFT.
Atomistic views of nitrogen bonded within layers and paired into molecules.
Two fates for nitrogen. Most N atoms bond into stable Mo–S–N complexes and stay put. Some pair up into N₂ molecules that keep diffusing through the MoS₂.

Why it matters

The benchmark helps researchers decide where UMA needs further validation before screening doped MoS₂ materials.

Recreate it yourself. Build doped MoS₂ cells, relax them with an ML potential, compute dopant formation energies, then heat a doped bilayer and watch the dopants move. Open the tutorial →


Next case study · Why MoS₂ space lubricants wear out in the cold → · Back to Machine-learning potentials research